Kashipara.com is a community of ONE million programmers and students, Just like you, Helping each other.Join them. It only takes a minute: Sign Up
Job Resume TemplateKashipara.com is a community of ONE million programmers and students, Just like you, Helping each other.Join them. It only takes a minute: Sign Up
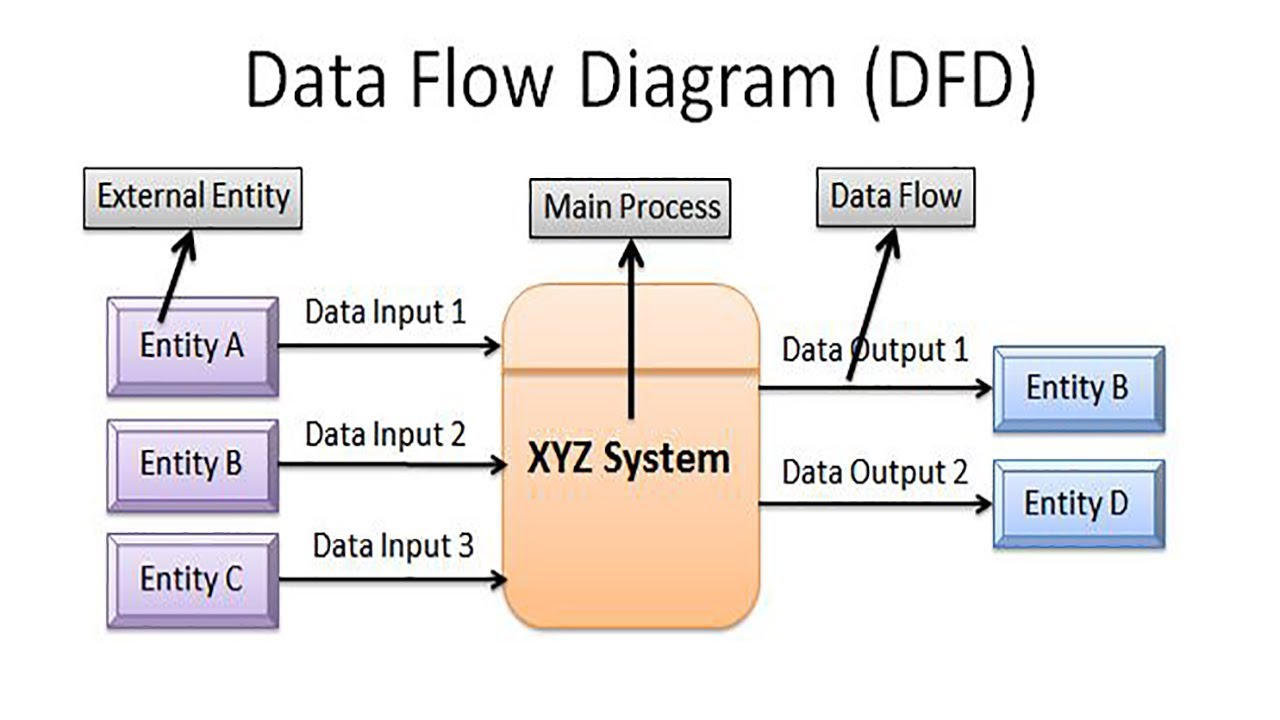
Job Resume TemplateDFD is the abbreviation for Data Flow Diagram. The DFD is also called as a data flow graph or bubble chart. The flow of data of a system or a process is represented by DFD. It uses defined symbols like rectangles, circles and arrows, plus short text labels, to show data inputs, outputs, storage points and the routes between each destination. It also gives insight into the inputs and outputs of each entity and the process itself.
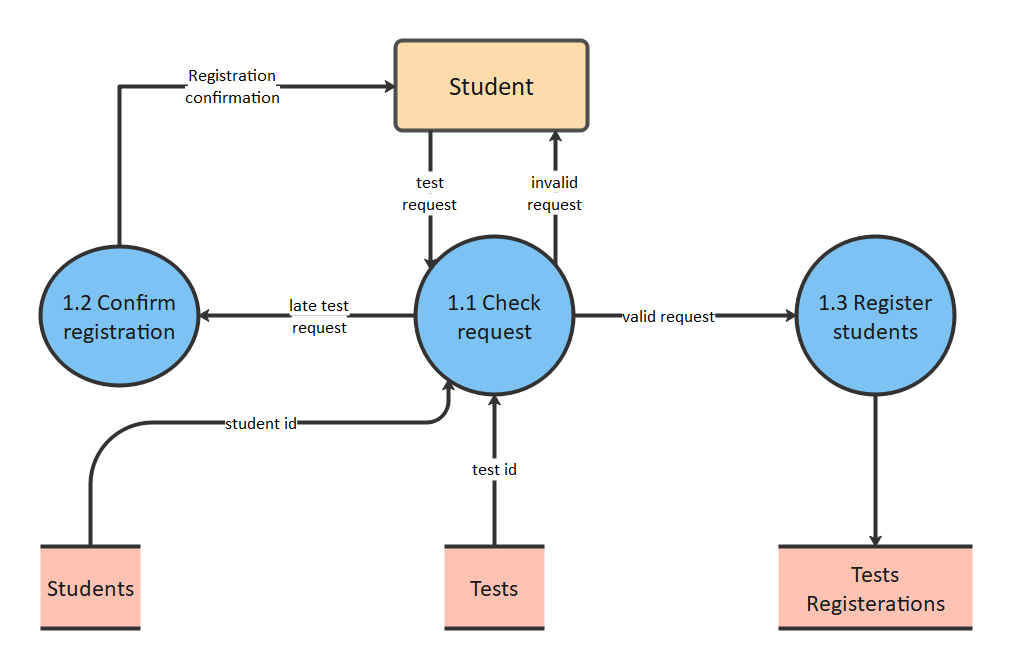
Data Flow diagrams are very popular because they help us to visualize the major steps and data involved in software-system processes. Data Flow Diagram represent detailed and well explained diagram of system components. Therefore all names should be unique. DFDs can also be used for the visualization of data processing (structured design) and show what kind of information will be input to and output from the system. This makes it easier to refer to elements in the DFD.
In addition, Data Flow Diagrams can be understood by both technical or nontechnical person because they are very easy to understand. Data Flow Diagram helps us to understand the functioning and the limits of a system.

Data flow diagrams were popularized in the late 1970s, arising from the book Structured Design, by computing pioneers Ed Yourdon and Larry Constantine. They based it on the “data flow graph” computation models by David Martin and Gerald Estrin. DFDs were usually used to show data flow in a computer system, although they could in theory be applied to business process modeling. Therefore it is more popular in business circles, as it was applied to business analysis.
Also contributing were two related concepts:
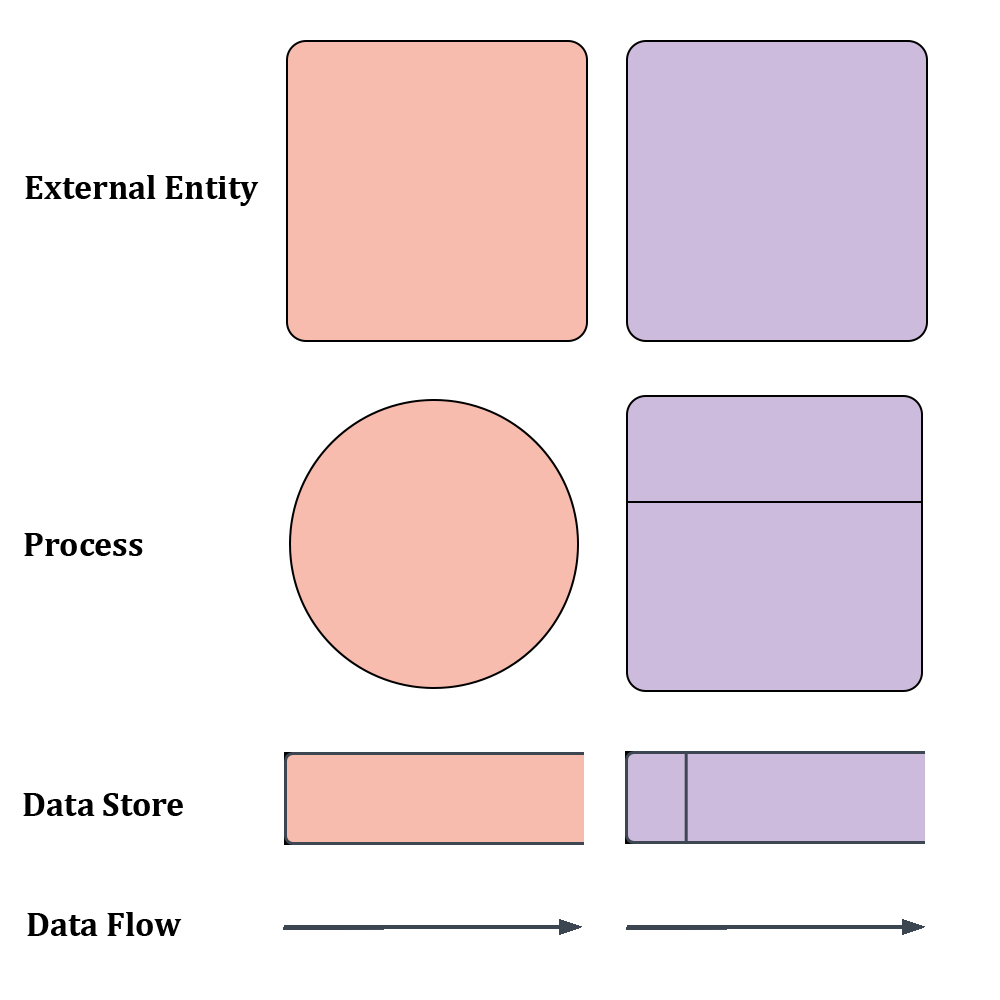
There are three common systems of symbols are named their creators:
One main difference in their symbols is that Yourdon-Coad and Yourdon-DeMarco use circles for processes, while Gane and Sarson use rectangles with rounded corners, sometimes called lozenges. There are other symbol variations in use as well, so the important thing to keep in mind is to be clear and consistent in the shapes and notations you use to communicate and collaborate with others.
Using any convention’s DFD rules or guidelines, the symbols depict the four components of data flow diagrams.
A data flow diagram can dive into progressively more detail by using levels and layers, zeroing in on a particular piece. DFD levels are numbered 0, 1 or 2, and occasionally go to even Level 3 or beyond. The necessary level of detail depends on the scope of what you are trying to accomplish.

Using DFD layers, the cascading levels can be nested directly in the diagram, providing a cleaner look with easy access to the deeper dive.