Kashipara.com is a community of ONE million programmers and students, Just like you, Helping each other.Join them. It only takes a minute: Sign Up
Job Resume TemplateKashipara.com is a community of ONE million programmers and students, Just like you, Helping each other.Join them. It only takes a minute: Sign Up
Job Resume TemplateWe are here to give you a full tutorial of making project report for any project of software. This project report or presentation will make your project easily understandable to client or user. In this, you represt your project by the help of Diagram i.e. class diagram, DFD diagram, ER diagram, Sequence diagram, Use Case dagram etc. We will cover all these topic in my tutorial. So, lets start the tutorial.
An entity relationship diagram (ERD) shows the relationships of entity sets stored in a database. An entity in this context is a component of data. In other words, ER Diagrams are most often used to design or debug relational databases in the fields of software engineering, business information systems, education and research.
At first View an entity relationship diagram looks very much like a flowchart. It is the specialized symbols, and the meanings of those symbols, that make it unique.
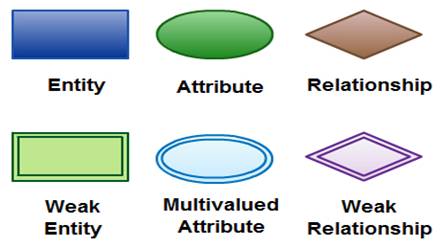
An entity. It define an object, a person or conecpt. Entities are represented by means of rectangles.

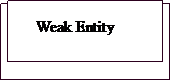
A weak entity is an entity that must defined by a foreign key relationship with another entity as it cannot be uniquely identified by its own attributes alone.
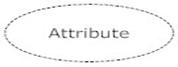
Attribute defines the property of entites, they are represented by means of ellipse and always connected by entity.

Multivalued attributes are depicted by double ellipse. A multivalued attribute can have more than one value.
Derived attributes are depicted by dashed ellipse. It is based on another attribute.
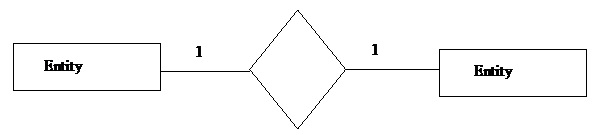
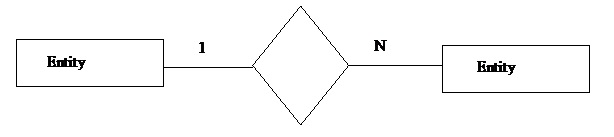
Relationships are represented by diamond-shaped box. Name of the relationship is written inside the diamond-box. All the entities (rectangles) participating in a relationship, are connected to it by a line.

When only one instance of an entity is associated with the relationship, it is marked as '1:1'. In one-to-one relationship one each entity should be associated with the relationship.
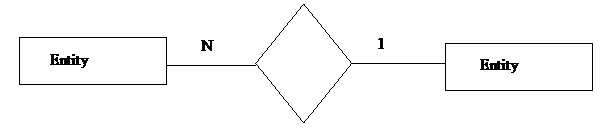
When more than one instance of an entity is associated with a relationship, it is marked as '1:N'. In one-to-many relationship each entity on the left and more than one instance of an entity on the right can be associated with the relationship.
When more than one instance of entity is associated with the relationship, it is marked as 'N:1'.In many-to-one relationship each entity on the right can be associated with the relationship.
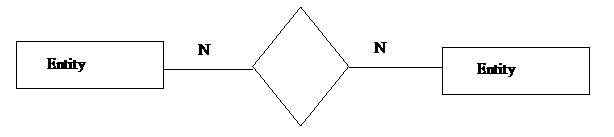
When more than one instance of an entity is associated with a relationship, it is marked as N:N'. In one-to-many relationship each entity on the left and more than one instance of an entity on the right can be associated with the relationship
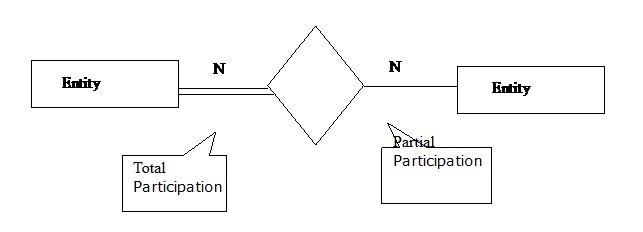
Total Participation − Each entity is involved in the relationship. Total participation is represented by double lines Partial participation − Not all entities are involved in the relationship. Partial participation is represented by single lines.